What Intermarket Divergence Actually Shows
Most divergence tools compare price swings with an oscillator on the same chart. This indicator does something structurally different: it compares pivot highs and lows on one currency pair against those of another pair the trader expects to move in the same or opposite direction. The logic comes from Smart Money Concepts, where a failure of two correlated markets to confirm each other can signal a hidden accumulation or distribution phase.
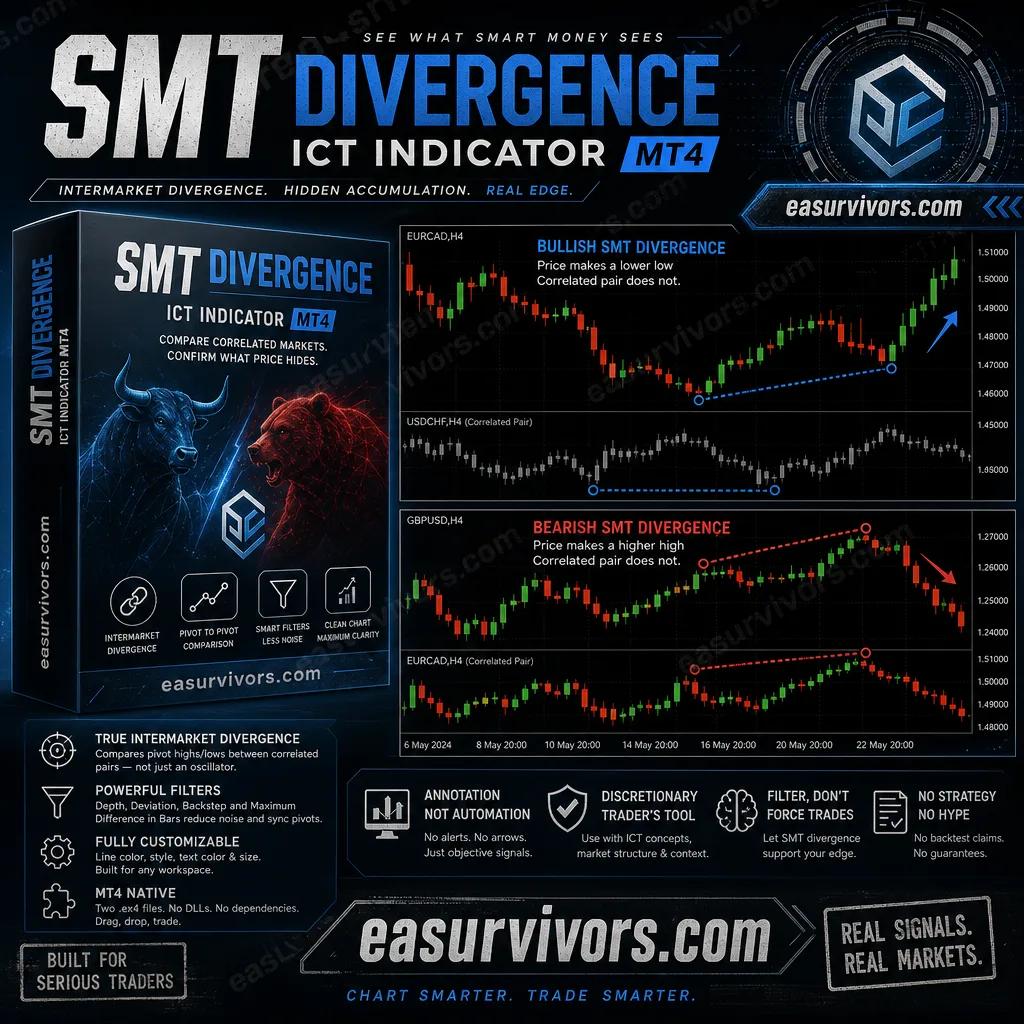
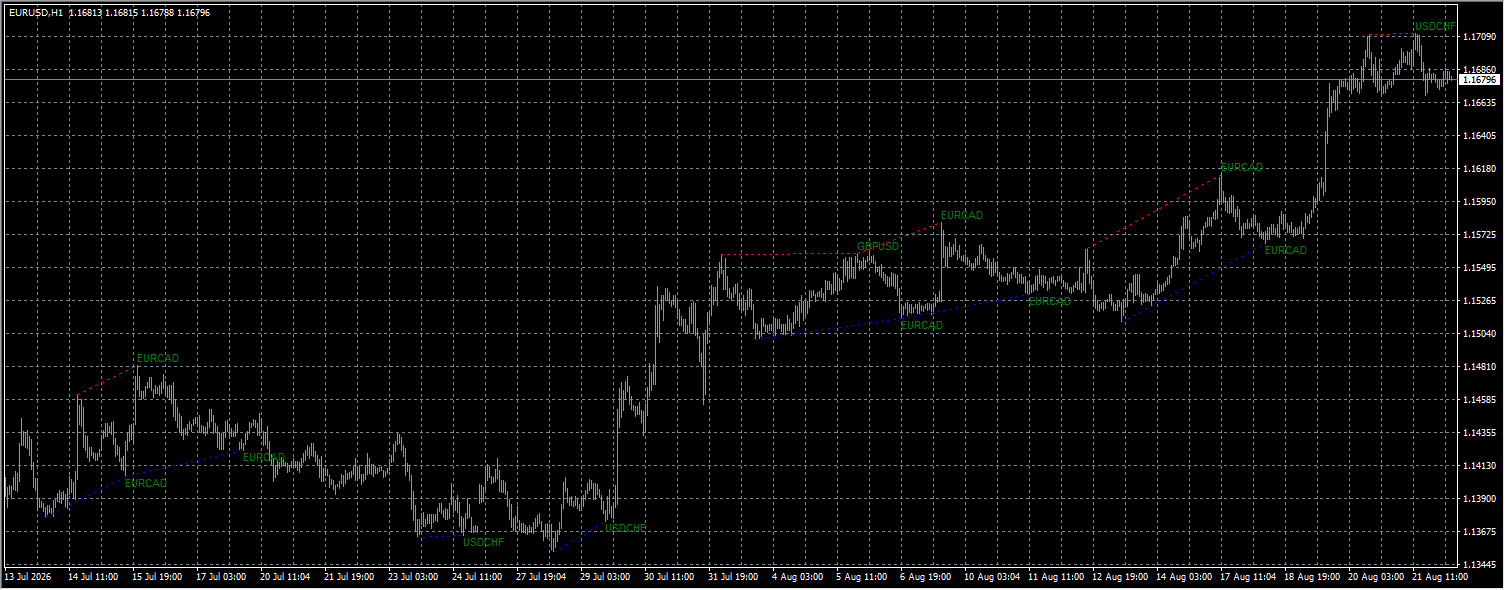
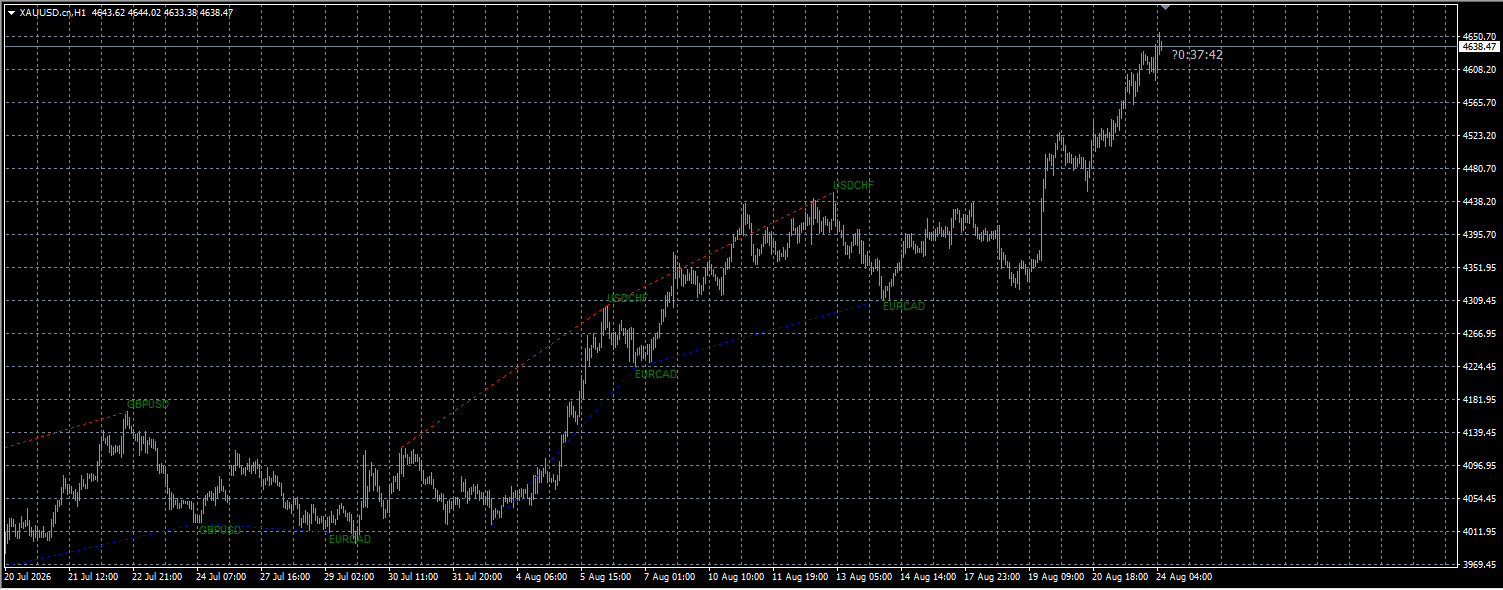
The practical output is a set of dotted lines plotted directly on the main chart. A blue line joins two lows, indicating a bullish SMT divergence where the chart pair made a lower low but the correlated pair did not. A red line joins two highs for the bearish equivalent. Nothing else is plotted, so the chart remains readable even with additional tools loaded.
What the Filter Settings Control
Three numeric parameters determine how aggressively the indicator marks divergences. Depth sets the number of bars used to locate pivot highs and lows. Deviation defines the minimum price difference required before a pivot is considered valid. Backstep controls the minimum bar distance between consecutive pivots. Together these filters let a trader reduce noise, but they also introduce latency: stricter values mean signals appear later, and weaker divergences are ignored entirely.
A separate parameter, Maximum Difference in Bars, caps the time gap allowed between the pivot on the main chart and the corresponding pivot on the comparison pair. This matters because intermarket signals can drift over time, especially on lower timeframes. The vendor suggests this control helps synchronise readings across pairs with slightly different session behaviours.
Pair Selection Is Not Automatic
The indicator does not scan the market for the strongest correlation. The user must specify which symbols to compare, split into two groups: directly correlated pairs and inversely correlated pairs. The default examples are GBPUSD, EURCAD and USDCHF, but these are not recommendations. A trader using this tool on EURCAD would set both the direct and inverse symbol lists based on their own correlation analysis or an external data source. Getting this mapping wrong produces meaningless lines.
How the Files Are Installed
The download includes two compiled files: the SMT Divergence indicator itself and a Candle Timer utility. Both are .ex4 files, so they can be placed in the MQL4/Indicators folder of a MetaTrader 4 installation without any DLL calls or external library dependencies. After restarting the terminal, the indicator appears in the Navigator under Custom Indicators and can be dragged onto any chart regardless of timeframe.
Visual settings cover the bearish and bullish line colours, line style, text colour and text size. For traders who work with multiple monitors or colour-blind overlays, these options are enough to make the signals visible without obscuring candlesticks. The indicator draws historical divergences only after being applied, so it does not repopulate from a pre-existing data feed beyond what the chart already holds.
Why This Is Not a Standalone Entry System
A sceptical trader will notice that SMT divergence is rare. On a quiet day, the indicator may not draw anything for hours. That is not a malfunction; it reflects the nature of intermarket confirmation. The tool does not generate alerts, arrows, or trade suggestions. It only marks the divergence after both pivots are complete, which means the signal can appear well after the actual price extreme.
For this reason, the vendor's own documentation recommends combining the output with market structure, liquidity levels, volume context and candlestick patterns. The realistic expectation is that this indicator works as a filter: before taking a reversal setup based on other analysis, a trader checks whether SMT divergence supports the direction. When the lines point the other way, the setup is downgraded or skipped.
There is no bundled strategy, no backtest report, and no predictive claim. The indicator does not require a specific minimum deposit or leverage because it does not execute trades. It is a chart annotation tool for discretionary traders who already understand the ICT framework and want to reduce the manual work of comparing pivots across multiple charts.